Blog
Is Cold Email Legal? US, Canada, UK and Australia Compared
Is cold email legal? Compare CAN-SPAM, CASL, UK PECR and Australia's Spam Act: legal basis, 2026 fines, enforcement cases, footer text and a checklist.

The average cold email reply rate ranges from 0.45% to 4.5% depending on the denominator. See B2B benchmarks, Salesloft step targets and how to fix sub-1%.
 Carlos AgüeroNov 3, 2026
Is cold email legal? Compare CAN-SPAM, CASL, UK PECR and Australia's Spam Act: legal basis, 2026 fines, enforcement cases, footer text and a checklist.
What a video landing page for sales outreach should include: five elements, templates by scenario, benchmarks and a QA checklist for SDR teams.

Why AI automation agency cold outreach fails in 2026: benchmark data, deliverability limits, AI SDR results and a six-step workflow that works.
Request a quote and our experts will contact you within 24 hours with tailored solutions and pricing.
You can also send us a quick email at support@sendpotion.com.
Last updated: Nov 3, 2026
By Carlos Agüero | Last updated October 22, 2026
The average cold email reply rate in B2B is somewhere between 0.45% (Belkins, 2026) and 4.5% (Hunter, 2026), depending on whether a study divides replies by emails sent, delivered or recipients, and whether auto-replies count.
That spread is why your VP's number and your dashboard rarely match. Gmail also began ramping up enforcement on non-compliant bulk mail in November 2025 (Valimail, 2025), so a weak rate can now be a delivery problem, not a copy problem. This guide reconciles the published averages, gives benchmarks for B2B SaaS and for Salesloft sequences, explains what a 1% rate really means, and shows how rates have moved since 2023. If plain text keeps underperforming, video outreach in a first-touch cold email is one fix worth testing.
Key Takeaways
- The average cold email reply rate ranges from 0.45% (Belkins, 2026) to 4.5% (Hunter, 2026) because each study divides by a different denominator.
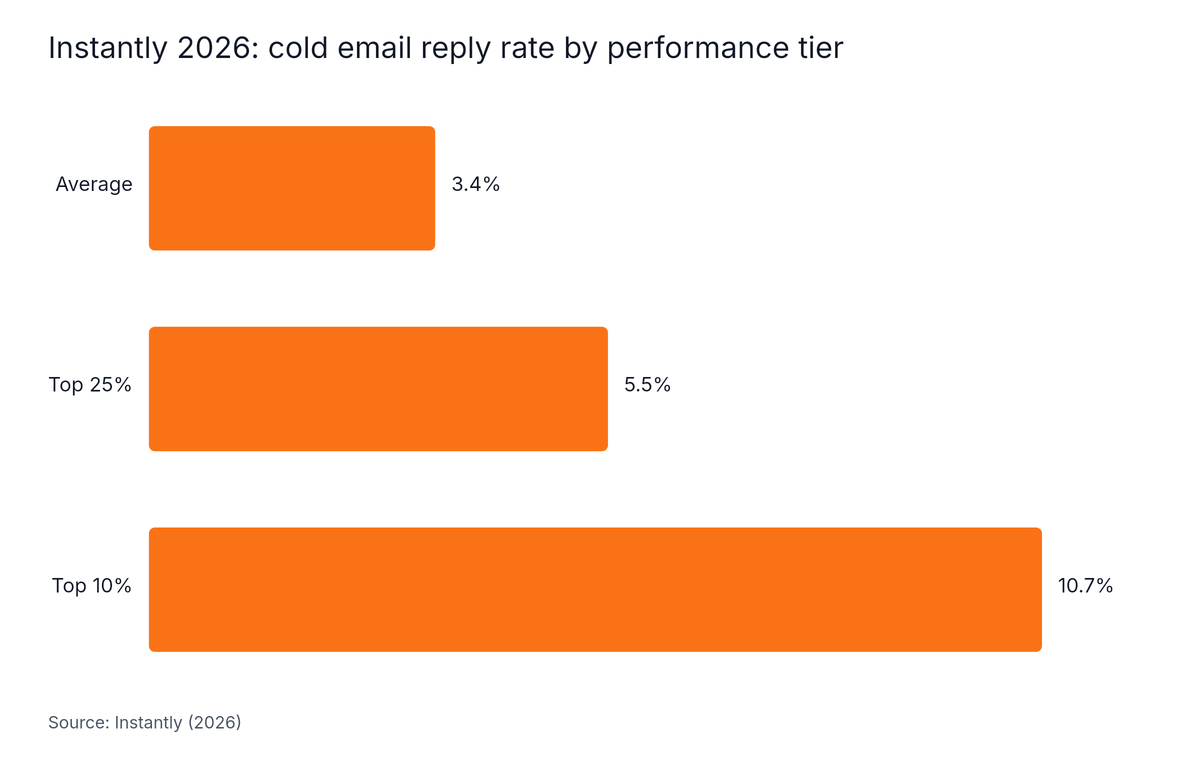
- Instantly's 2026 report sets 3.43% as the platform average, 5.5% as top quartile and 10.7% or more as top 10% (Instantly, 2026).
- A 1% reply rate is above Belkins' strict 0.45% average and below Hunter's 3% sales-sequence average, so the method decides the verdict.
- Salesloft step targets are best set by share of replies: 58% come from step one and 42% from follow-ups (Instantly, 2026).
- Published two-year trends are not one series, so compare only studies that use the same method.
In this guide
A good cold email response rate is one that beats the average of the dataset you are measured against. In Instantly's 2026 benchmark report, the platform-wide average is 3.43%, the top quartile starts at 5.5%, and the top 10% reaches 10.7% or more (Instantly, 2026). Strict sends-based studies report much lower averages.

Reply rate is the share of cold emails (or recipients) that produce a response, divided by whatever denominator the study chose. That choice matters more than most teams realize, so a "good" number only means something next to its method.
Instantly's report describes the typical outcome this way: "In other words, the typical cold email response rate falls around lower single digits." (Instantly, 2026)
| Tier | Reply rate | What it means |
|---|---|---|
| Average | 3.43% | Platform-wide mean in Instantly's 2026 report |
| Top quartile | 5.5% | Threshold to beat three in four senders |
| Top 10% | 10.7%+ | Threshold for the best-performing tenth |
Source: Instantly, 2026.
Source: Instantly, 2026
The key numbers are 3.43% (average), 5.5% (top quartile) and 10.7%+ (top 10%) (Instantly, 2026). One caution applies. Instantly's figures come from self-serve platform data, so they include poorly targeted senders, and the page does not state the denominator. Treat the tiers as a reference band, not a quota.
The average cold email reply rate depends on the denominator: 0.45% of all emails sent (Belkins, 2026), 2.09% across 2M+ emails (Sales.co, 2026), 3.43% platform-wide (Instantly, 2026) and 4.5% per recipient (Hunter, 2026). Before accepting a below-average verdict, check what each figure divides by and whether auto-replies were counted.
A denominator is the number a study divides replies by: emails sent, emails delivered, or unique recipients. Change it and the same campaign produces a different rate.
| Source | Average | Sample | Method note |
|---|---|---|---|
| Belkins, 2026 | 0.45% | 7.5M emails sent in 2025 | Replies divided by total emails sent; open tracking disabled |
| Sales.co, 2026 | 2.09% | 2M+ emails, 100+ industries | 28,632 replies from 1,369,823 contacts emailed |
| Instantly, 2026 | 3.43% | Billions of interactions | Self-serve platform data; denominator not stated |
| Hunter, 2026 | 4.5% | 31M emails sent in 2025 | Per-recipient sequence reply rate |
Belkins describes its result as "a figure that reflects strict cold outreach to net-new contacts, with no open-rate inflation" (Belkins, 2026). That is the most conservative reading on the table, which is why it is the lowest.
A positive reply rate is the share of replies (or of contacts) that show real interest rather than an auto-reply or a refusal. An auto-reply is an automated response such as an out-of-office message. Sales.co's February 2026 analysis shows how much these distinctions change the picture:
| Metric | Value | Basis |
|---|---|---|
| Average reply rate | 2.09% | Across 2M+ cold emails |
| Auto-replies | 45.1% | Share of all replies |
| Positive replies | 14.1% | Share of all replies |
| Interested replies | ~0.64% | Share of contacts |
Source: Sales.co, 2026.
In the researchers' words: "Only 14.1% of replies are genuinely positive." (Sales.co, 2026) So a reported 2% reply rate can hide a much smaller conversation rate.
If the answers do not line up with how your team reports, the "below average" verdict compares two different measurements.
A B2B SaaS team should benchmark against a range rather than one number, because no source publishes a methodology-backed SaaS figure. Hunter's 2025 data puts sales outreach sequences at a 3% average (Hunter, 2026), while Cleverly says SaaS reply rates are often under 2% (Cleverly, 2026). Your own segment history is the better yardstick.
Cleverly's industry breakdown says SaaS and software sit at the bottom of reply rates, often under 2%, despite the highest open rates. Its methodology and sample are not shown, so read it as directional. Saleshandy's 2026 analysis (Saleshandy, 2026) is reported to say the opposite, that SaaS had the highest reply rates, though the excerpt reviewed gives no figure. Both claims cannot be right, and neither is verified.
| Segment | Reply rate | Source and method |
|---|---|---|
| Companies with 11-50 employees | 0.49% | Belkins, 2026 (replies per email sent) |
| Companies with 10,000+ employees | 0.22% | Belkins, 2026 (replies per email sent) |
| Sales outreach sequences | 3% | Hunter, 2026 (per recipient) |
| Marketing-focused campaigns | 6.2% | Hunter, 2026 |
| Headhunting | 7.5% | Hunter, 2026 |
| Digital PR | 13% | Hunter, 2026 |
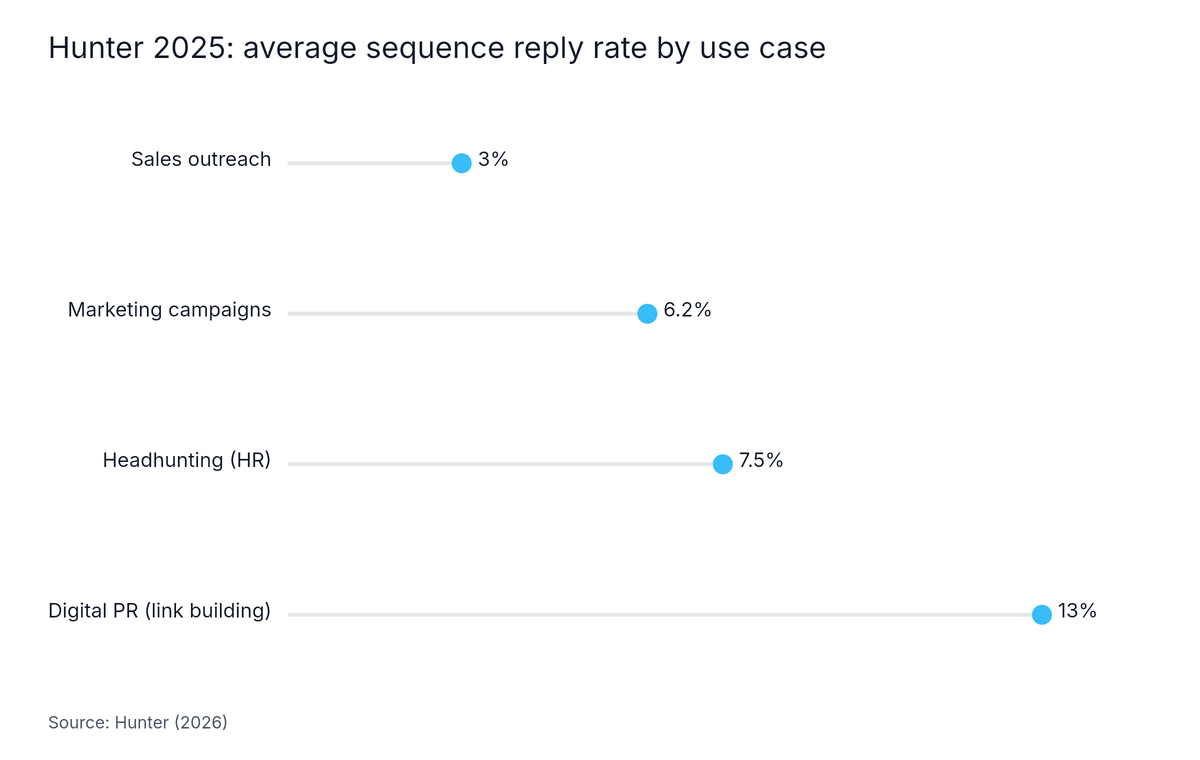
Source: Hunter, 2026
Two patterns hold. Smaller companies reply more: 0.49% for 11-50 employees against 0.22% for 10,000+ employees (Belkins, 2026). And use case matters: sales outreach averages 3% in Hunter's data while digital PR reaches 13% (Hunter, 2026). Do not mix the Belkins and Hunter rows, because they use different denominators.
For a SaaS team, a defensible approach is to set the target between the sources' readings, then replace it with your own trailing 90-day rate by persona and company size. A deeper look at message formats that earn replies is in these video prospecting examples.
A 1% reply rate on B2B cold email is normal on a strict sends-based measure and low on a per-recipient measure. Belkins measured 0.45% across 7.5 million emails in 2025 (Belkins, 2026), while Hunter's sales outreach sequences averaged 3% (Hunter, 2026). Check deliverability, list size and sender setup before rewriting copy.

Hunter's 2025 data shows large gaps tied to how sequences are sent. This is correlational platform data, not a controlled test, so it shows association, not proof.
| Practice | Better setup | Worse setup |
|---|---|---|
| Open tracking | 7.4% (off) | 4.4% (on) |
| Sender domain | 5.2% (custom domain) | 2.5% (freemail) |
| List size per sequence | 6.2% (21-50 recipients) | 2.4% (500+ recipients) |
Source: Hunter, 2026.
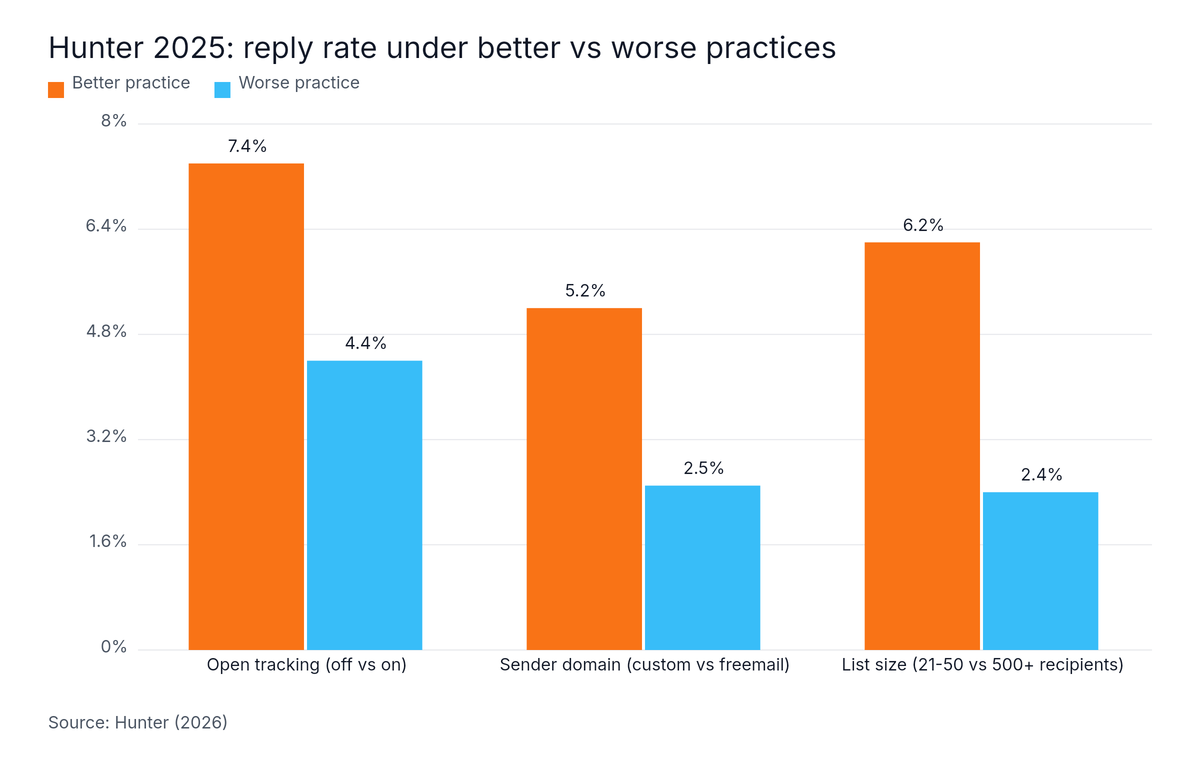
Source: Hunter, 2026
Sequences sent to 21-50 recipients got 6.2%, against 2.4% for 500+ recipients, a gap Hunter reports as +158% (Hunter, 2026). Sending from a custom domain returned 5.2% against 2.5% from freemail, and sequences with open tracking off got 7.4% against 4.4% with it on.
Deliverability is whether your email reaches the inbox at all, and a sub-1% rate can be an inbox-placement failure instead of a messaging failure. Google's guidance, as quoted by Valimail, states: "Starting November 2025, Gmail is ramping up its enforcement on non-compliant traffic." (Valimail, 2025) Non-compliant bulk mail (5,000+ messages a day) now faces temporary and permanent rejections, not only spam-foldering.
Microsoft began enforcing SPF, DKIM and DMARC for senders of 5,000+ messages per day to Outlook.com, Hotmail and Live on May 5, 2025, routing non-compliant mail to junk or rejecting it (dmarcian, 2025).
A sensible triage order:
Salesloft cadence steps are best benchmarked by share of replies, because no current public Salesloft per-step benchmark exists. Instantly's 2026 data shows 58% of replies come from step one and 42% from follow-ups (Instantly, 2026). Apply that split to your own total reply rate to set a defensible target for each touch.
Salesloft's own cadence benchmark PDFs date from 2020 and 2021, which is too old to cite. A step split built from recent platform data is the safer base for a Sales Development Representative (SDR) team.
The table applies Instantly's 58/42 split to Hunter's 3% average for sales outreach sequences (Hunter, 2026). The last column is our arithmetic on that hypothetical total, not a published Salesloft benchmark.
| Reply source | Share of total replies (Instantly, 2026) | Illustrative target at a 3% total reply rate |
|---|---|---|
| Step one | 58% | 1.74% |
| All follow-ups combined | 42% | 1.26% |
| Total | 100% | 3.00% |
Instantly's page does not break the 42% down by individual follow-up step, so any per-step target past step one has to come from your own history.
If step one holds close to 58% but total volume is low, the problem is the first email or the list. If follow-ups produce far less than 42%, review follow-up timing and angle.
Cold email reply rates have not moved in one direction since 2023, because the major studies changed how they measure. Belkins reported 6.8% in 2023 and 5.8% in 2024 on replies per opener (Apollo, 2026), then 0.45% in 2025 on replies per email sent (Belkins, 2026). Hunter's average rose from 4.1% in 2024 to 4.5% in 2025 (Hunter, 2026).

| Series | Period | Rate | Basis | Comparable across rows? |
|---|---|---|---|---|
| Belkins, as reported by Apollo (2026) | 2023 to 2024 | 6.8% to 5.8% (15% decline) | Replies per opener | Only with each other |
| Belkins (2026) | H1 to H2 2025 | 0.50% to 0.40% (20% decline) | Replies per email sent | Only with each other |
| Hunter (2026) | 2024 to 2025 | 4.1% to 4.5% | Per-recipient sequence | Only with itself |
Within 2025, Belkins' monthly rate peaked in February at 0.54% and bottomed in December at 0.35% (Belkins, 2026). The original Belkins 2024 study page was not retrieved, so verify the Apollo-reported 5.8% and 6.8% figures before relying on them.
Video prospecting is the practice of putting a personalized video in a cold email instead of relying on text alone. No independent 2026 benchmark measures a video lift, so the baseline to beat is Hunter's 3% average for sales outreach sequences (Hunter, 2026). Potion's own results are company data, not third-party research.
Text-only sequences face prospects with heavy inbox fatigue and tighter spam filtering on high-volume plain-text sends. Manual recording breaks through, but it caps a rep's daily volume. AI personalization is the use of generated, prospect-specific content (here, video) at scale, and it removes that cap.
Our data: GrowPronto booked 45 meetings and closed 7 accounts with Potion, according to Potion's published case study.
Potion's own materials quote more than one reply-rate lift figure, and those figures have not been reconciled, so this guide does not repeat a numeric lift. Run your own test against your measured baseline instead.
Video does not replace the basics above. Hunter's data links a custom sending domain to a 5.2% reply rate against 2.5% from freemail (Hunter, 2026), and no video fixes mail that never reaches the inbox. For the mechanics, see how to send personalized videos at scale and what video email marketing looks like for B2B sales.
Published cold email reply rate benchmarks from Instantly, Belkins and Hunter are not a target for every team, because they come from vendor platforms and agency campaigns with different denominators and samples. Belkins measured 0.45% on agency-managed sends (Belkins, 2026) while Hunter reported 3% for sales sequences (Hunter, 2026), so use the figures as ranges.
Specific limits to keep in mind:
A good cold email response rate in 2026 is one that beats the average for your measurement method. Instantly's 2026 report puts the platform average at 3.43%, with 5.5% as the top-quartile threshold and 10.7% or more for the top 10% (Instantly, 2026). Belkins' strict sends-based figure is 0.45% (Belkins, 2026), so always confirm the denominator first.
A 1% cold email reply rate is not automatically bad. It is above Belkins' 0.45% average for 2025 sends (Belkins, 2026), but below Hunter's 3% average for sales outreach sequences (Hunter, 2026). Check the denominator, then deliverability, list size and sender setup before concluding that the messaging is the problem.
Auto-replies count in some cold email reply rates and not in others, which is why published averages differ. Sales.co's February 2026 analysis found that 45.1% of replies were auto-replies (Sales.co, 2026). If your tool counts them, your reported reply rate overstates real conversations, so track a positive reply rate as well.
No 2026 source in this data sets a target range for positive reply rate, but Sales.co gives a reference point. It found only 14.1% of replies were positive, and an effective interested-reply rate of about 0.64% of contacts (Sales.co, 2026). Use those for context and build a baseline from your own campaigns.
Some cold email reply rates have dropped since Google tightened sender rules, but the data cannot prove cause. Belkins' reply rate fell from 0.50% in the first half of 2025 to 0.40% in the second half, a 20% decline (Belkins, 2026), while Gmail began ramping up enforcement in November 2025.
The average cold email reply rate is a range from 0.45% (Belkins, 2026) to 4.5% (Hunter, 2026), not a single number, so the first job is to match the measurement method before judging your own results. Then rule out deliverability, set step targets from reply shares, and compare years only within one study method.
To test whether video lifts your own reply rate, Start Free Trial.
Continue learning: video prospecting examples with scripts and video outreach in a first-touch cold email.
Written by
Carlos Agüero
Carlos Agüero builds tools that help B2B sales teams sell smarter. As part of TargetGrid.ai, Skale.email, and Potion, he's focused on multi-channel outreach automation, inbox deliverability, and AI-powered video. Berkeley Haas COBE. Based in Santiago, Chile. Passionate about helping sales teams close more, faster, with less manual work.