Personalized video statistics: what reply lift is realistic for B2B outreach?
By Carlos Agüero, who builds AI video tools for B2B sales teams. Disclosure: he builds Potion, an AI personalized video product.
Personalized video statistics show that video can lift B2B cold email replies, but no independent, controlled post-2024 study supports the 500% vendor claim, so a realistic planning range is a modest gain up to about 2x, to be tested. Personalized video is a short video recorded or generated for one prospect, using their name, company or website. Cold email baselines are tiny and shrinking, which makes big multipliers sound better than they are. Below you'll find the baselines, what each lift means against them, where video belongs in a sequence, and a test design you can run. For the wider method, see the video prospecting playbook.
Key Takeaways
Independent baselines for B2B cold email reply rates run from 0.45% (Belkins, 2026) to 4.5% (Saleshandy, 2026), so any personalized video "lift" depends on the baseline you start from.
A 5x personalized video lift on Instantly's 3.43% average would land above Instantly's 10.7% top-10% mark (Instantly, 2026).
A realistic planning hypothesis for personalized video is a modest relative gain up to about 2x, to be confirmed in your own A/B holdout.
Over 53% of email-sourced meetings come from sequence step 3 or later (Belkins, 2026), so judge video on whole-sequence meetings, not first-touch replies.
Vendors claim personalized video lifts replies by 500%. What reply-rate lift is realistic for a B2B SDR team?
A realistic reply-rate lift from personalized video for a B2B Sales Development Representative (SDR) team is a hypothesis between a modest gain and roughly 2x, not 500%. No independent, controlled post-2024 study supports the larger claim, and a 5x lift on Instantly's 3.43% average reply rate would land above the 10.7% top-10% mark (Instantly, 2026).
A sales rep recording a short to-camera video beside a window in a bright office
The 500% figure circulates in video marketing roundups, but no primary source was found for it. It appears to relate to marketing conversions rather than SDR replies. Multipliers of 2x to 5x trace back to vendor marketing and case studies, not to a like-for-like control group. The "modest gain up to about 2x" range here is a planning hypothesis to test, not a measured result.
What does a top-decile result look like?
Instantly puts the top 10% of cold email senders at 10.7%+ reply rates (Instantly, 2026). Gong's authors offer a similar rule of thumb, which is an opinion from their consulting experience rather than a measurement: "10%+ is the gold standard based on Outbound Squad's experience working with customers." (Gong, 2026). A video campaign hitting low double digits would already sit at top-tier text-email performance.
What moves replies more than video?
Rep skill and targeting may move cold email replies more than any single tactic. Gong Labs found top reps get 4.2x the replies of average reps (Gong, 2026). Treat that figure as directional: Gong's pages cite inconsistent sample sizes (25M in the summary, 28M+ in the body). The comparison with video is our reasoning, not Gong's: a 4.2x spread between reps suggests execution may matter at least as much as adding video.
What baseline reply rate does a personalized video lift apply to?
The baseline that any personalized video lift applies to ranges from 0.45% to 4.5%, depending on who counts replies. Belkins measured 0.45% across 7.5M net-new emails sent in 2025 (Belkins, 2026), Instantly reports 3.43% platform-wide (Instantly, 2026), and Saleshandy found 4.5% across 30.31M cold emails (Saleshandy, 2026).
Reply rate is the share of sent emails that receive a reply, and vendors differ on whether auto-replies and follow-up replies count. That difference explains most of the gap between sources.
Belkins describes its number as "a figure that reflects strict cold outreach to net-new contacts, with no open-rate inflation" (Belkins, 2026). Instantly summarizes its own data this way: "In other words, the typical cold email response rate falls around lower single digits." (Instantly, 2026).
How wide are the reply-rate tiers?
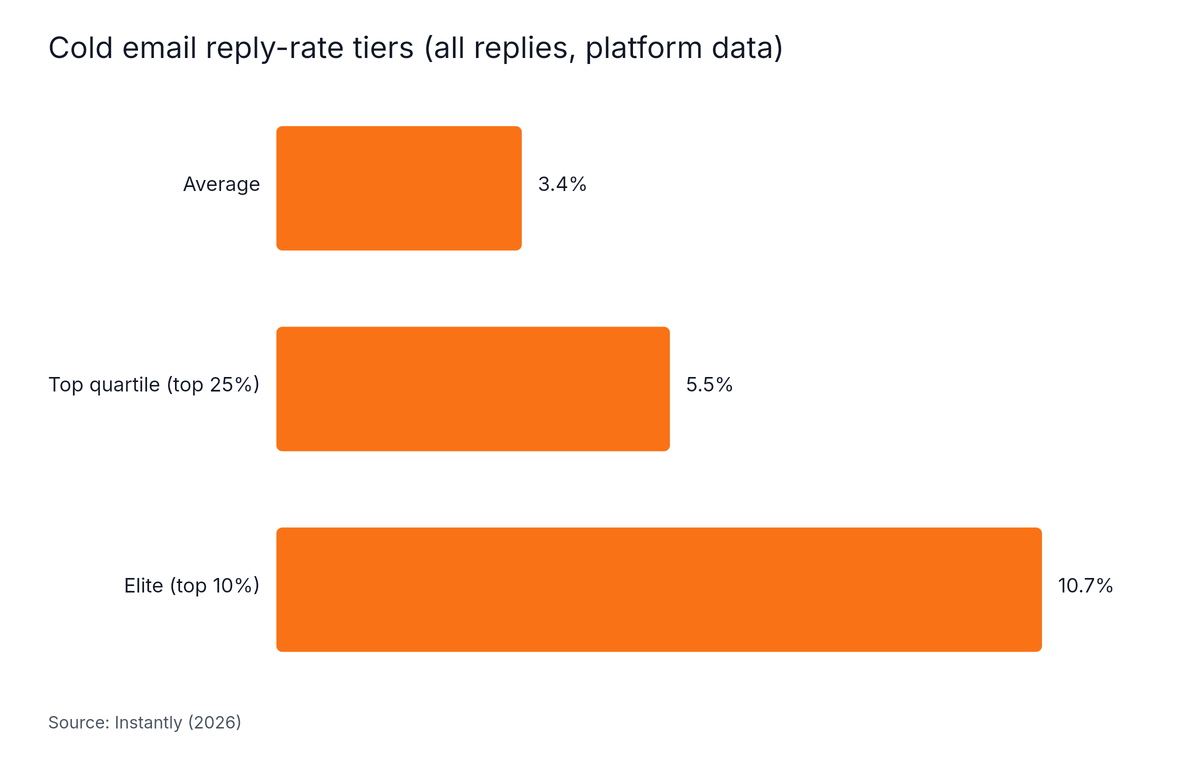
Instantly puts the average at 3.43%, the top quartile at 5.5% and the top 10% at 10.7%+ (Instantly, 2026). Saleshandy reports that campaigns above 7% outperform typical ones and those above 20% are among its strongest (Saleshandy, 2026).
Horizontal Bar chart: Cold email reply-rate tiers (all replies, platform data). Highest: Elite (top 10%) at 10.7%.
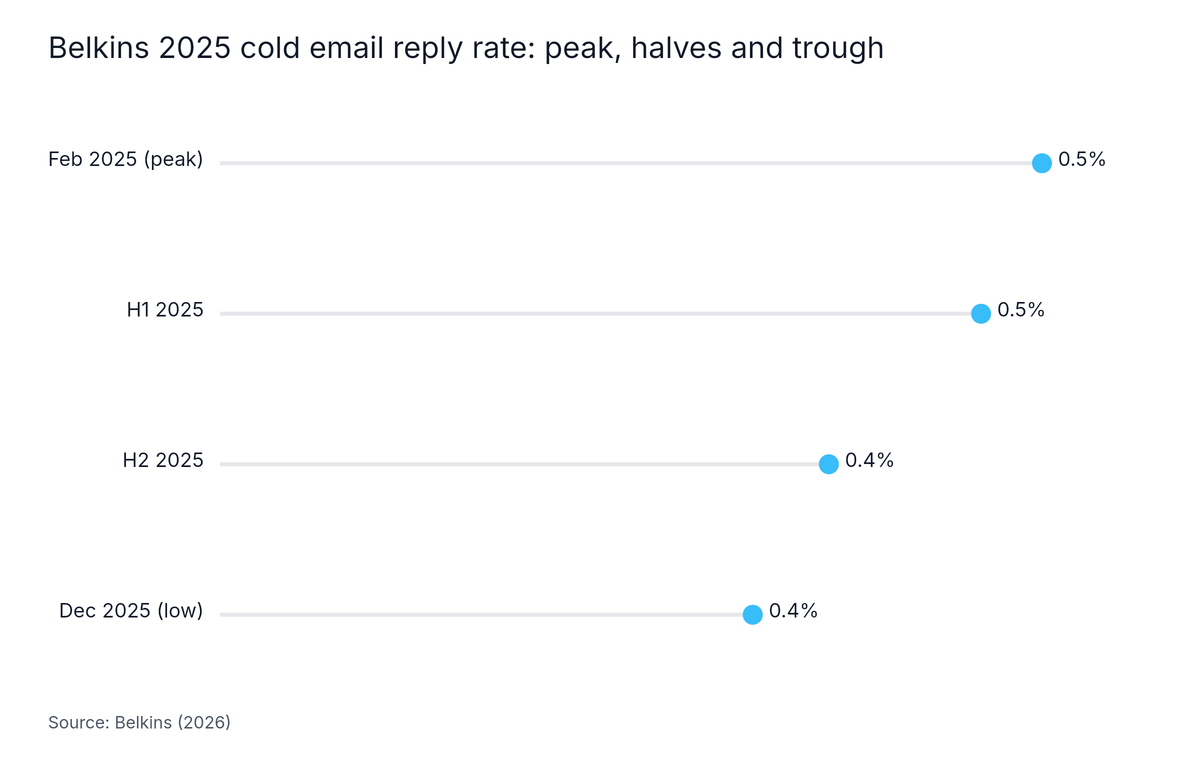
The B2B cold email reply-rate baseline is falling. Belkins' reply rate averaged 0.50% in the first half of 2025 and 0.40% in the second half, a 20% decline, with a February peak of 0.54% and a December low of 0.35% (Belkins, 2026). The same video lift now yields fewer absolute replies.
Lollipop chart: Belkins 2025 cold email reply rate: peak, halves and trough. Highest: Feb 2025 (peak) at 0.5%.
How does the same lift change absolute reply rates?
Relative lift is the percentage or multiple a tactic adds to a baseline, while absolute lift is the change in the reply rate itself. The same multiple gives very different results: 5x on Belkins' 0.45% baseline stays below Instantly's 3.43% average, but 5x on Saleshandy's 4.5% passes the 20%+ level Saleshandy calls among its strongest (Belkins, 2026; Saleshandy, 2026).
A printed sheet of reply-rate percentages with a pen and calculator on a table
The table shows where a 2x and a 5x lift would land against each source's own benchmark tiers. These placements are our arithmetic on cited baselines, not measured video results.
Above the 20%+ level Saleshandy calls among its strongest
A vendor quoting 5x against a sub-1% baseline and a team quoting it against 3% are describing very different worlds. Only the first is plausible without top-decile performance.
Cold email is also a crowded channel. Gartner's survey of 632 B2B buyers found 73% avoid suppliers who send irrelevant outreach (Gartner, 2025). Personalization has to be relevant, not just visible.
If you want to test a lift of your own without recording every clip by hand, you can generate AI videos in your own face, voice, and gestures at scale and run a small holdout. The mechanics are covered in sending personalized videos without recording each one.
Should personalized video go in the first email or a follow-up?
Personalized video placement matters because replies and meetings arrive at different points in a sequence. Instantly found 58% of cold email replies come from step one, with 42% from later steps (Instantly, 2026), while Belkins found over 53% of email-sourced meetings come from sequence step 3 or later (Belkins, 2026). Test video in the opener and in follow-ups separately.
A sales manager reviewing a printed outreach sequence with sticky notes marking steps
The two datasets pull in opposite directions: replies skew early, meetings skew late. A video that lifts first-touch replies but adds nothing to meetings is a weak result, so judge it on whole-sequence meetings. For a closer look at first-touch use, see video outreach in a first-touch cold email.
How does video compare with other channels?
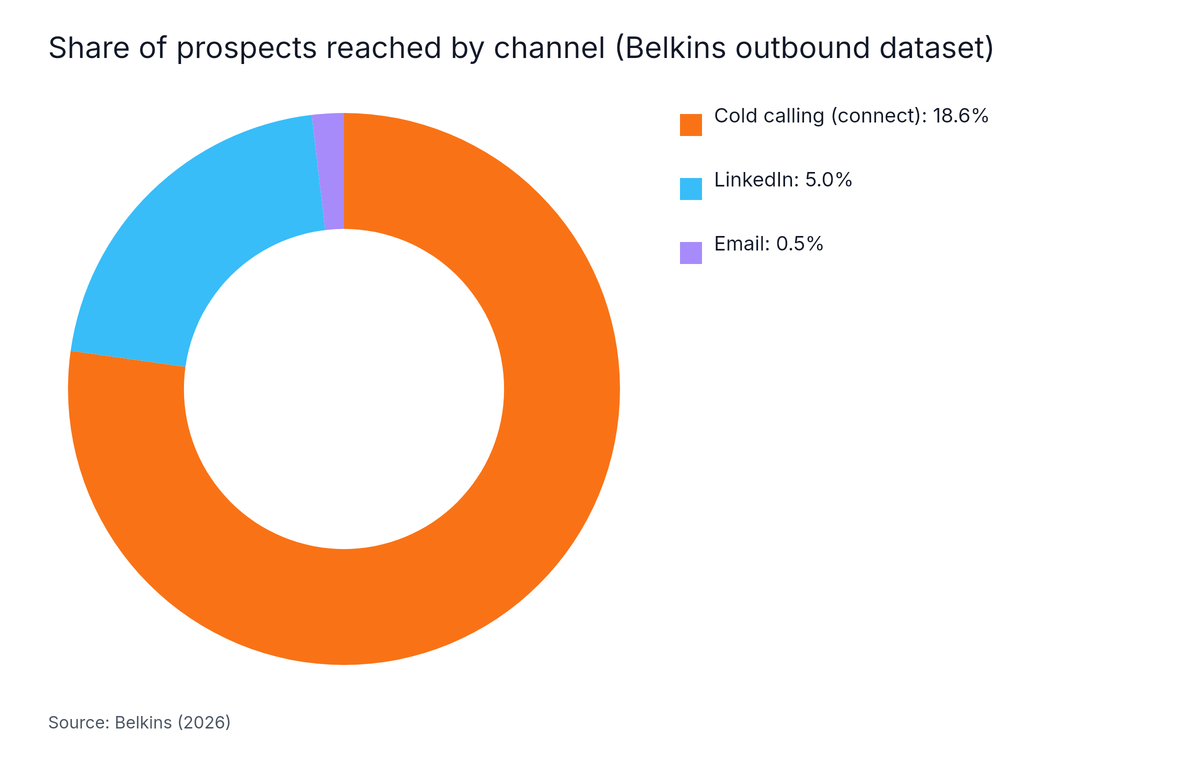
Video prospecting is the use of short sales videos inside cold outreach sequences, and it competes with other escalation channels. Belkins' outbound calls connected with 18.6% of prospects reached, versus 5.04% for LinkedIn and 0.45% for email, and cold calling accounted for 33.6% of 2025 appointments booked (Belkins, 2026).
Donut chart: Share of prospects reached by channel (Belkins outbound dataset). Highest: Cold calling (connect) at 18.6%.
LinkedIn delivered 7%+ reply rates, stable across all 12 months of 2025, and the Messenger campaign benchmark was 12.22% for existing connections (Belkins, 2026). These non-video benchmarks show that 10% to 15% replies do not automatically need video.
How do you measure reply and booking rates for a video campaign?
Measure a personalized video campaign with an A/B holdout, tracking replies, positive replies and meetings booked per 100 sends for each arm. Use a strict reply definition: Belkins counted unique replies, excluded auto-replies, and found a 0.45% average across 7.5M net-new emails in 2025 (Belkins, 2026). No source publishes video-specific booking rates, so your own control group is the benchmark.
Two colleagues at a whiteboard sketching a split test with two groups of prospects
An A/B holdout is a test in which one random group of prospects gets the new tactic while a control group does not. A positive reply is a response that shows interest, such as agreeing to a call or asking for details. Use positive replies alongside raw replies, because auto-replies and "not interested" answers inflate the raw number.
A simple test design
Pick one segment, ideally your A-tier accounts, and split the list at random into two equal groups.
Send the control group text only. Send the test group the same copy plus a personalized video.
Run a second test with video on touch 3 to 5 instead of touch 1.
Count replies, positive replies and meetings booked per 100 sends in each group.
Compare absolute differences, not just multiples, and repeat before changing your cadence.
Metric
What to count
Why it matters
Replies per 100 sends
Unique human replies, auto-replies excluded
Comparable with Belkins' strict definition
Positive replies per 100 sends
Replies showing interest
Filters out noise
Meetings per 100 sends
Booked and held
The outcome that pays
Our data: SendPotion's customer data shows GrowPronto booked 45 meetings and closed 7 accounts with Potion. It is a single customer outcome, not a controlled test, and it states no send volume, so treat it as an example rather than a benchmark.
Who should not rely on these personalized video statistics?
Personalized video statistics are not a forecast for every team. The baselines here come from text-email datasets and vendor platforms, not from a controlled video test, so the range from a modest gain to about 2x is a planning hypothesis. Belkins' 0.45% and Instantly's 3.43% averages (2026) show how much definitions differ, and teams with tiny, hand-picked lists may see different results.
Keep these limits in mind:
Vendor data. Belkins, Instantly and Saleshandy publish their own platform or client data, and each counts replies differently.
No controlled video study. No independent, controlled post-2024 study of video versus text in B2B cold email was found.
Survivorship. Published video wins tend to be best-case campaigns, so average results are likely lower.
AI is not automatically better. A Digital Applied analysis of 100K paired cold emails found AI-written emails at a 4.1% reply rate versus 5.2% for human-written, with spam flags at 8% versus 3% (Digital Applied, 2026). It is a lower-authority source, but a fair caution for scaled personalization.
Frequently Asked Questions
What reply and booking rates do video prospecting campaigns typically see?
No independent source publishes video-specific reply or meeting-booked rates with a stated denominator. The text-email baselines that video is measured against run from 0.45% (Belkins, 2026) to 4.5% (Saleshandy, 2026). Track replies, positive replies and meetings per 100 sends in your own holdout to get a number you can trust.
What is a good cold email reply rate for SDRs in 2026?
A good cold email reply rate for Sales Development Representatives (SDRs) depends on how replies are counted. Instantly reports a 3.43% platform average, a 5.5% top quartile and 10.7%+ for the top 10% (Instantly, 2026). Belkins' stricter count of net-new emails averaged only 0.45% in 2025 (Belkins, 2026).
Should personalized video go in the first cold email or in a follow-up?
Personalized video should be tested in both places, because the data does not settle it. Instantly found 58% of cold email replies come from step one (Instantly, 2026), while Belkins found over 53% of email-sourced meetings come from sequence step 3 or later (Belkins, 2026). Compare meetings per 100 sends for each placement.
How do you A/B test video versus text outreach for an SDR team?
A Sales Development Representative (SDR) team should split one segment at random into two equal groups, send text only to the control group, and send the same copy plus a personalized video to the test group. Then compare replies, positive replies and meetings booked per 100 sends. Belkins' 0.45% unique-reply average (Belkins, 2026) shows why small absolute differences matter.
What should you do with personalized video statistics?
Personalized video can lift B2B cold email replies, but the evidence supports a modest, testable gain rather than 500%. Independent baselines run from 0.45% (Belkins, 2026) to 4.5% (Saleshandy, 2026), so the same multiplier means very different absolute results. Plan around a hypothesis of up to about 2x and verify it in your own holdout.
The main takeaways:
Pick one baseline definition and stick to it.
Judge video on meetings per 100 sends across the whole sequence.
Test the opener and follow-ups as separate arms.
Your next step is a two-arm holdout on one A-tier segment. For ideas on what to put in the video itself, read about video email marketing for B2B sales.
Written by
Carlos Agüero
Carlos Agüero builds tools that help B2B sales teams sell smarter. As part of TargetGrid.ai, Skale.email, and Potion, he's focused on multi-channel outreach automation, inbox deliverability, and AI-powered video. Berkeley Haas COBE. Based in Santiago, Chile. Passionate about helping sales teams close more, faster, with less manual work.

 Carlos AgüeroNov 12, 2026